Assessing the impact of a hydropower project on land cover through remote sensing
In mid 2017 a proposed hydropower project in north-west Myanmar required an assessment of potential environmental impact. Four different levels of dam were considered, each of which would lead to varying amount of water inundation upriver of the new dam. Remote sensing data was used to provide an initial assessment of the types and amount of land cover that would be affected by this increased water level.
This assessment made use of the Semi-Automatic Classification plugin for QGIS, by Congedo Luca. This is an incredible resource for QGIS users, and various tutorials are available on Luca’s site.
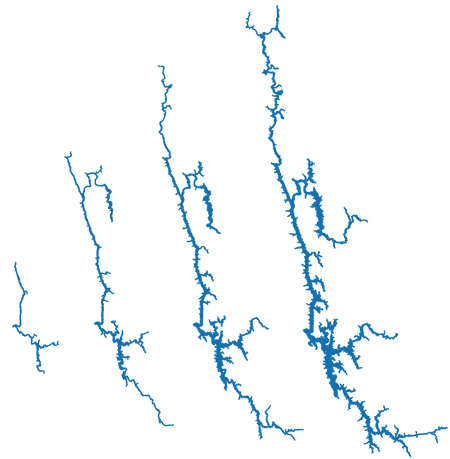
The hydropower company provided shapefiles of the four projected levels of potential water inundation along the river, based on an earlier assessment. As the dam size increases, the water level rises further above the existing banks, and the consequences are spread further up the river.
To determine land cover for the affected areas, the SCP plugin was used to analyse satellite imagery from the Sentinel-2 satellite. Part of the European Space Agency’s Copernicus Programme, this data is available to the public through the programme’s open data hub. Since cloud cover in the relevant section of Myanmar increases dramatically during the rainy season, the last available image with low cloud cover was used, in this case from the 18th of February 2017.
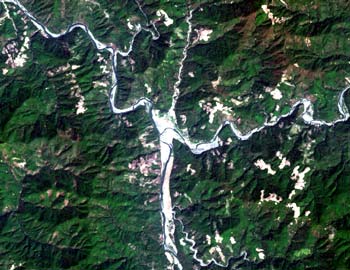
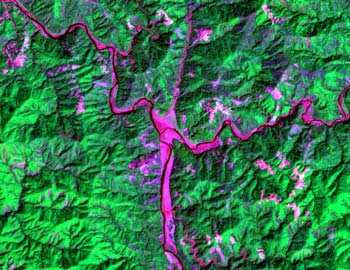
Besides RGB values allowing simple true colour imagery down to a 10m resolution, the Sentinel platform has various other spectral bands available. This allows analysis of the spectral characteristics of land cover, not normally visible to the human eye. A typical use of this is to calculate the Generated Normalized Difference Vegetation Index (NDVI), showing the health of vegetation. For example, the below extract shows true colour imagery, and then a combination of Sentinel 2’s red, near infrared and shortwave infrared bands.
The SCP plugin must be trained to recognize the spectral characteristics of different land cover types – this involves selecting areas where the land cover type is known, and registering them as reference points for the analysis.
Five categories were used for this analysis: cleared ground, low density vegetation, high density vegetation (forest), riverbank and water. The detection of villages and minor outbuildings is challenging in this region due to very low urban density, broad spectral ranges due to materials used, and the fact that buildings are usually closely interspersed with low and high density vegetation. Buildings in this analysis mainly contribute to the cleared ground category.
The land cover of the entire area is then classified according to these reference values. This raster file is then clipped according to the four different scenarios.
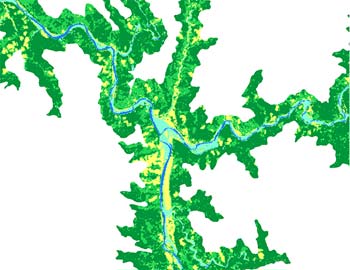
These individual rasters can then be analysed to determine the type and amount of land cover types that would be affected by the increased water level. The results were as follows:
| Scenario 1 (smallest) | Scenario 2 | Scenario 3 | Scenario 4 (largest) | |
|---|---|---|---|---|
| Riverbank | 3.5 | 9.8 | 13.2 | 17.8 |
| Cleared ground | 2.2 | 5.6 | 9.1 | 16.6 |
| Low density vegetation | 2 | 13.5 | 32.3 | 58.9 |
| High density vegetation | 2.2 | 20.1 | 61.5 | 132.8 |
| Total inundation | 9.9 | 49 | 116.1 | 226.1 |
This process is a useful and relatively simple way to make an initial assessment of the impact on land cover - using only publically available applications and data. There are however some limitations that would need to be considered as part of more detailed follow up assessment.
Firstly, ground truthing should accompany this kind of remote sensing work to ensure that assumptions regarding land cover characteristics are accurate. Secondly, this analysis was based on a single satellite image from February. Seasonal changes to vegetation and shifting cultivation methods used in the area mean that the nature of land cover is likely to vary over time, meaning that category of land cover in the affected areas may not be stable.
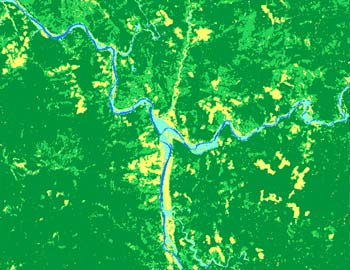
The sequence of images below shows an example of change in land cover over time.
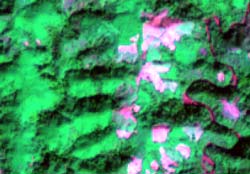
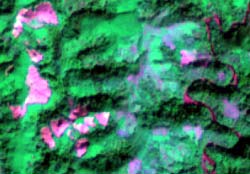
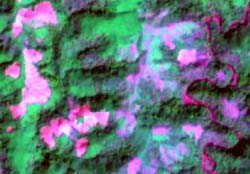
In January 2016 cleared ground is visible near to the river. One year later these areas have begun to regrow, and activity has shifted to newly cleared ground to the west. Just one month later these areas have further expanded, but the area in general has seen an increase in what appears to be lower density vegetation, potentially due to the increased heat of the season. These changes need to be understood to ensure that analysis is accurate.
Thanks again to Congedo Luca for the SCP plugin.
For other projects, return to the main page.