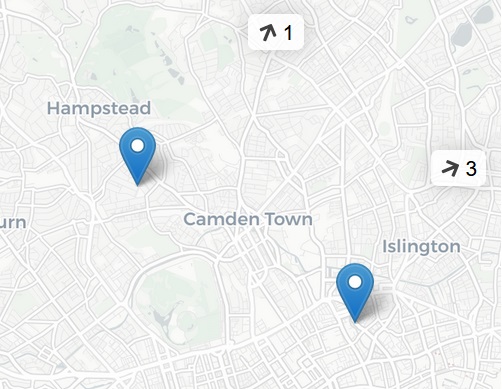
Leaflet Signposts
A Leaflet.js plugin that displays arrows and a count of points found outside the current map view in each given direction. Link goes to GitHub repository; click through to demo from there.
JS/CSS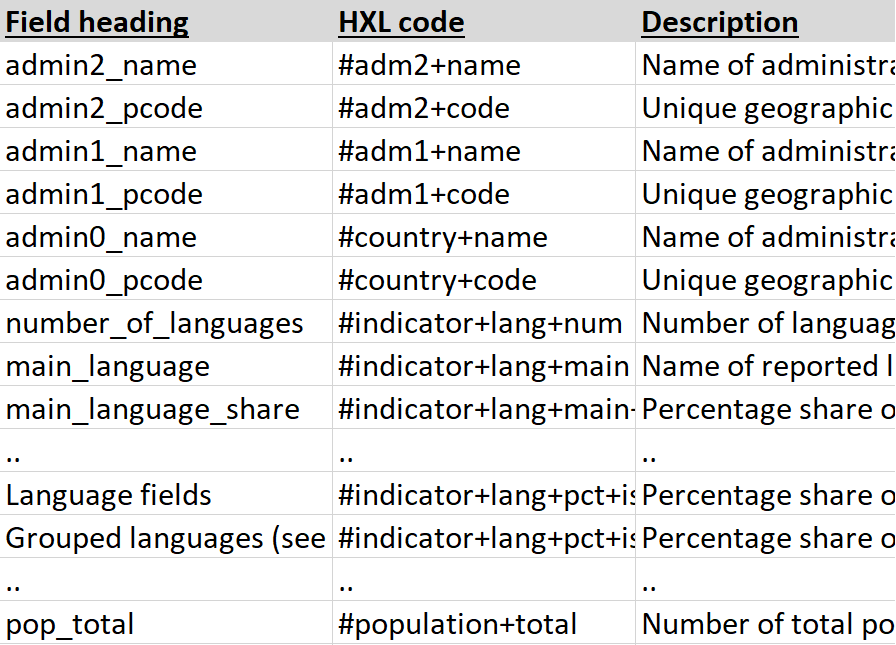
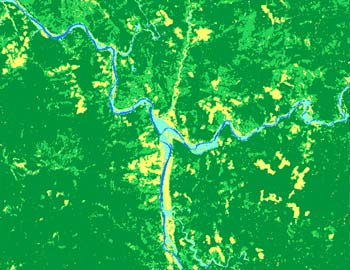
Building better language data for humanitarian responses
An informal write up of a project with UCL and TWB, designing and building language data products for incorporation into humanitarian workflows. Includes user-centered design, and a broad selection of data work.
R, Python, SQL, QGIS, HXL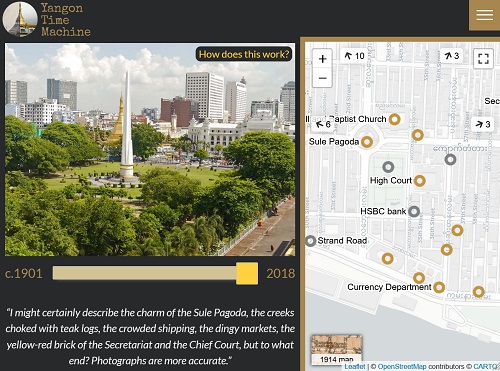
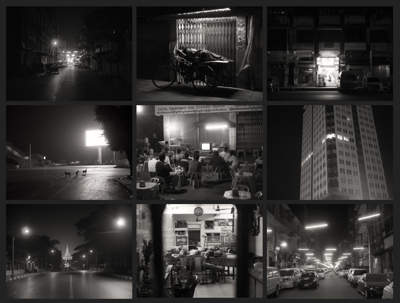
Yangon Time Machine
Then-and-now photography of Yangon, accompanied by articles discussing the buildings shown in the images, and how their stories tie into that of the city. Custom built website.
Photography, Research, Wordpress, OpenLayers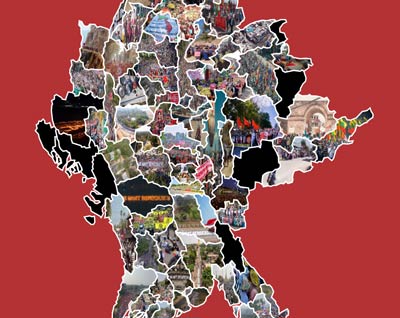
Myanmar Resists
An interactive map and image gallery celebrating the truly nationwide nature of the protests against the February 2021 coup in Myanmar.
Raphael JS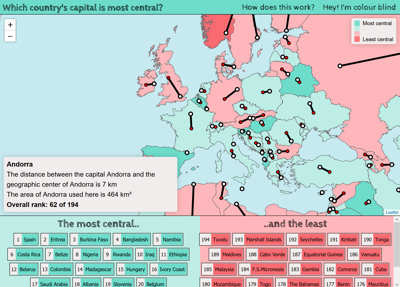
Which country's capital is most central?
A long winded but ultimately decisive response to the question of which country has the most geographically central capital. Potentially good pub quiz knowledge.
ArcMap/QGIS, R, Leaflet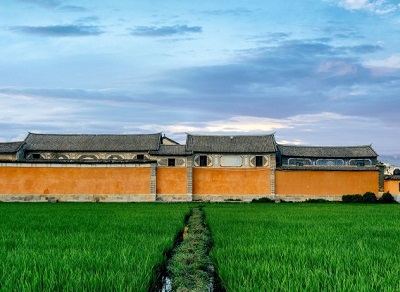
Linden Centre Artist Residency
Three outputs of an artist residency in Xizhou, near Dali in Yunnan Province, China: then-and-now photography, an interactive timeline of Dali and Yunnan's history, and a Yangon Time Machine article.
Photography, research, timelineJS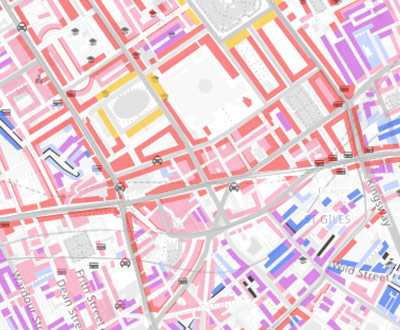
Predicting modern patterns of wealth with historical poverty data
An investigation into the relationship between the Booth poverty maps and modern patterns of affluence. Includes vectorisation, spatial analysis, and spatial regression for predictive analysis.
QGIS, R, GeoDa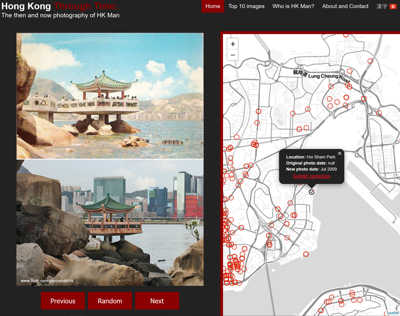
Hong Kong Through Time
Over 1000 then-and-now images of Hong Kong, taken by Flickr user HK Man and displayed here on a webmap. Completed partly in the hope of identifying the mysterious HK Man. Labelled and geocoded with Python, displayed with Leaflet.
Leaflet, Python, HTML/CSS/JS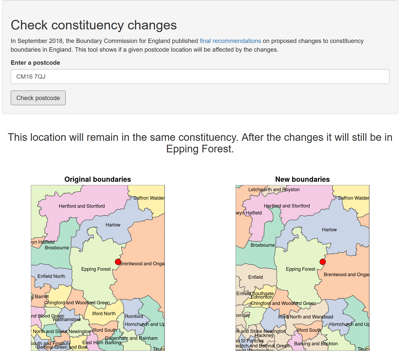
English constituency boundary change tool
A small application built in Shiny to allow residents of England to see if planned changes to political boundaries will affect them.
R, Shiny